For decades, scientists have warned that the world’s glaciers are retreating. What was once a distant threat confined to the poles and mountaintops is now visible from space, with technology that transforms invisible heat into hard evidence.
Thanks to advances in infrared satellite imaging, researchers can now see melting ice in real time, measure subtle temperature shifts across massive ice fields, and quantify just how quickly the Earth’s frozen reservoirs are disappearing.
This is the story of how infrared technology—once used primarily for military surveillance and astronomy—has become one of the most powerful tools in the global fight against climate change.
1. Why Glaciers Matter: The Planet’s Frozen Thermostat
Glaciers are not just beautiful remnants of the Ice Age; they are crucial regulators of Earth’s climate system. These massive rivers of ice act as natural thermometers, storing freshwater, reflecting sunlight, and stabilizing ocean circulation.
When glaciers melt faster than they can accumulate snow, the consequences ripple across the planet:
-
Rising sea levels threaten coastal cities and island nations.
-
Ocean salinity changes disrupt marine ecosystems.
-
Reduced freshwater runoff affects agriculture and drinking water supplies.
-
Feedback loops amplify global warming as reflective ice gives way to darker, heat-absorbing surfaces.
For scientists and policymakers, tracking glacier health isn’t just about saving scenic landscapes—it’s about monitoring the planet’s climate engine in real time.
2. The Problem: The Ice Is Melting Faster Than We Can Measure
Traditional methods of studying glaciers relied on field expeditions—teams of researchers trekking through harsh conditions to plant markers, drill ice cores, or measure meltwater flow. These missions were time-consuming, expensive, and often limited to small sample areas.
But the world’s glaciers cover about 10% of Earth’s land surface, many located in inaccessible regions like Antarctica, Greenland, and the Himalayas.
Field measurements alone can’t keep up with the accelerating pace of change. Scientists needed a better way—one that could see the entire cryosphere at once, from orbit.
That’s where infrared satellite imaging came in.
3. Seeing Heat from Space: The Science Behind Infrared Imaging
Infrared radiation lies just beyond visible light in the electromagnetic spectrum. While humans can’t see it, we can feel it as heat.
Infrared cameras detect this thermal energy and translate it into images that reveal temperature differences between objects or surfaces.
When applied to glacier research:
-
Cold ice emits less infrared radiation, appearing dark or blue in thermal maps.
-
Melting zones and warmer surfaces emit more radiation, appearing brighter.
-
Changes in infrared signatures over time show how heat is spreading through ice masses.
This allows satellites to create high-resolution thermal maps of glaciers, showing not just surface melt but also subsurface warming, crevasse formation, and even hidden meltwater channels.
4. The Eyes in the Sky: Satellites Tracking Ice from Orbit
A handful of Earth-observing satellites now specialize in thermal monitoring, using infrared sensors to watch our glaciers around the clock.
a. NASA’s Landsat Series
Since 1972, Landsat satellites have captured detailed thermal and visual images of Earth’s surface. The Thermal Infrared Sensor (TIRS) on Landsat 8 and 9 provides global coverage every 16 days, allowing scientists to detect temperature anomalies on glaciers worldwide.
b. ESA’s Sentinel-3
Operated by the European Space Agency, Sentinel-3’s Sea and Land Surface Temperature Radiometer (SLSTR) delivers continuous temperature readings, helping track ice sheet melt across Antarctica and Greenland.
c. Terra and Aqua MODIS
NASA’s Moderate Resolution Imaging Spectroradiometer (MODIS) instruments, aboard Terra and Aqua satellites, provide near-daily coverage, ideal for monitoring short-term melting events or seasonal patterns.
d. ICESat-2 and CryoSat
While not purely infrared, these satellites combine laser altimetry and thermal sensors to measure ice thickness and volume—giving a 3D view of how glaciers shrink vertically and horizontally.
Together, these orbital instruments form a global observatory, capturing billions of data points each year and transforming them into visual evidence of climate change.
5. Making the Invisible Visible: What Infrared Reveals
Infrared imagery turns the abstract concept of “melting ice” into something tangible. It shows patterns and behaviors invisible to the naked eye:
a. Subtle Warming Before Melting
Infrared can detect temperature rises before visible melting occurs. This early warning helps predict glacier collapses or surges that might flood nearby regions.
b. Heat Transfer from Ocean to Ice
Infrared data reveals how warm ocean currents erode glaciers from below—a major cause of ice shelf disintegration in Antarctica.
c. Surface Water Mapping
Infrared imaging detects the formation of melt ponds—pockets of water that absorb sunlight and accelerate melting. Tracking these ponds helps predict when ice sheets might destabilize.
d. Snow Albedo and Pollution
Soot and dust on snow reduce its reflectivity. Infrared cameras can spot these “dirty snow” zones, quantifying how pollutants amplify heat absorption and melting.
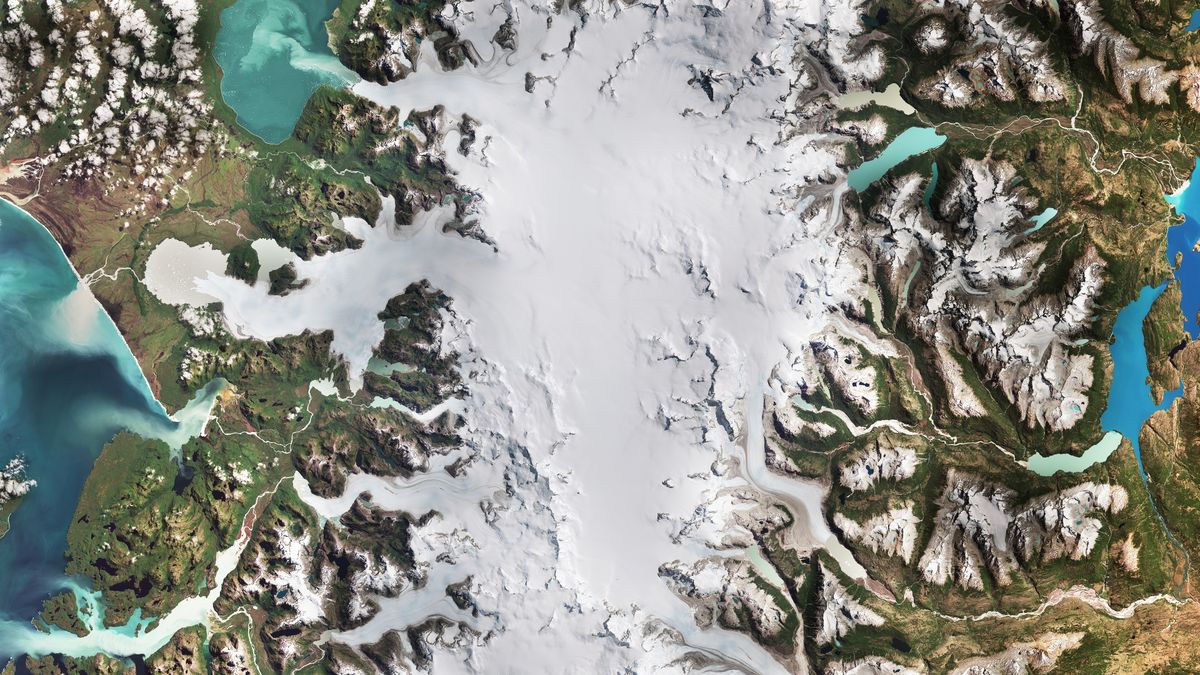
6. Case Study: Greenland’s Disappearing Ice
Nowhere is the impact of infrared monitoring more dramatic than in Greenland—home to the world’s second-largest ice sheet.
Over the past two decades, satellites have documented:
-
Rising surface temperatures of up to 3°C in coastal areas.
-
Expansion of melt zones visible in infrared images, spreading higher inland each summer.
-
Rapid thinning of outlet glaciers such as Jakobshavn, which has retreated more than 40 kilometers since the 1990s.
Infrared time-lapse data shows seasonal cycles of freezing and melting—until recent years, when the “freeze” portion has visibly shortened. The result is clear: Greenland is now losing billions of tons of ice per year, contributing measurably to global sea-level rise.
7. Antarctica: The Giant Awakens
Antarctica once seemed immune to rapid change, but infrared satellites are now painting a more troubling picture.
The Thwaites Glacier, often dubbed the “Doomsday Glacier,” is melting from beneath where warm ocean water creeps under its ice shelf. Infrared imaging helps map this subsurface heat transfer, exposing how cracks form and icebergs calve into the sea.
Over the past decade, satellites have recorded:
-
Expanding thermal hotspots at the base of ice shelves.
-
Surface melt zones spreading across the Antarctic Peninsula.
-
Seasonal anomalies showing that Antarctic summers are lasting longer and growing warmer.
This data isn’t just imagery—it’s evidence that Antarctica’s massive ice sheet is now actively participating in the global climate shift.
8. High-Altitude Melting: The Himalayas and the Third Pole
Infrared satellites have also revolutionized how we study glacier melt in the Himalayas, often called “the Third Pole” because of its vast ice reserves.
These glaciers feed rivers that sustain over a billion people across Asia, including the Ganges, Indus, and Yangtze.
Infrared data reveals alarming patterns:
-
Glaciers in Nepal and Bhutan are losing ice at unprecedented rates.
-
Surface temperatures in the region have increased by more than 1°C in just two decades.
-
Many glaciers are now forming large meltwater lakes—a growing flood risk to downstream communities.
Infrared imagery not only maps these lakes but also helps predict glacial lake outburst floods (GLOFs) before they strike.
9. The Power of Time: Decades of Data Tell the Story
Infrared satellites have been orbiting Earth for more than 50 years. This continuity allows scientists to create historical heat maps—a time-lapse of planetary warming.
When compared decade by decade, the change is staggering:
-
Infrared brightness over polar regions has steadily increased.
-
Melt seasons have lengthened by 20–40 days in many regions.
-
Previously “stable” glaciers now show constant thermal activity.
In short, satellites have provided irrefutable visual proof that the Earth’s cryosphere is in rapid retreat.
10. How AI Enhances Infrared Climate Monitoring
The next evolution of infrared monitoring involves artificial intelligence.
AI models can process vast amounts of satellite data faster than human analysts, detecting patterns that might otherwise go unnoticed.
For example:
-
Machine learning algorithms identify early-stage melting zones before they appear visually.
-
Predictive models estimate future melt rates based on thermal trends.
-
Automated anomaly detection alerts scientists to sudden glacier surges or collapses.
AI transforms raw infrared data into actionable climate intelligence—enabling faster, more accurate global monitoring.
11. From Space to Policy: Turning Data into Action
Infrared imaging doesn’t just serve scientists; it shapes real-world decisions.
Governments and climate organizations use satellite data to:
-
Model sea-level rise and plan coastal defenses.
-
Prioritize conservation efforts in regions losing ice fastest.
-
Monitor compliance with environmental treaties and emissions targets.
-
Inform the public, turning invisible processes into powerful visual stories.
Infrared images—stark and undeniable—often serve as the smoking gun in climate debates, translating complex science into visuals anyone can understand.
12. The Public Impact: Changing Minds with Images
A photo of a melting glacier speaks volumes—but an infrared map showing rising temperatures across decades can change minds.
Documentaries, news outlets, and climate education programs now use infrared visuals to communicate the urgency of the crisis.
For many people, seeing Earth’s heat signatures evolve in false-color reds and oranges drives home a simple truth:
The planet is heating before our eyes.
13. Challenges and Limitations
Despite its power, infrared monitoring faces a few challenges:
-
Cloud cover and moisture can distort thermal readings.
-
Surface reflectivity differences complicate snow and ice interpretation.
-
Calibration between multiple satellite instruments must be maintained for accuracy.
Still, ongoing improvements in sensor resolution, calibration algorithms, and data fusion continue to enhance reliability.
14. The Future: Next-Gen Satellites and Global Collaboration
The next generation of infrared satellites promises unprecedented precision.
Projects like NASA’s NISAR, ESA’s Copernicus Expansion Missions, and China’s Gaofen series are expanding the global eye on ice.
Future systems will combine:
-
Hyperspectral imaging to detect even finer temperature gradients.
-
Real-time global monitoring updated hourly.
-
Cloud-penetrating radar + infrared fusion, revealing hidden melt zones beneath snow layers.
These innovations mean we’ll soon be able to track the Earth’s cryosphere continuously, in near real-time, with precision down to a few meters.
15. Why It Matters: Seeing the Unseen Future
Infrared satellites don’t just show what’s happening—they warn us about what’s coming.
They reveal the early stages of change, long before humans can see or feel it.
By making the invisible visible, they give policymakers, scientists, and communities the information they need to act before it’s too late.
Every pixel of infrared data is a piece of our planet’s temperature history—a heat signature of change, captured in space and preserved for humanity to learn from.
The story these satellites tell is not just scientific—it’s profoundly human. It’s about our shared responsibility to protect a planet whose warming can now be measured, mapped, and made unmistakably real.
Conclusion: A Mirror in the Sky
Infrared satellite imaging has become the mirror through which Earth sees its own fever.
From Greenland’s retreating ice fronts to the silent cracking of Antarctica’s shelves, the message is clear and urgent:
The planet is changing fast—and we can now see it happening in living color.
By watching from above, we’ve finally learned to listen to what the glaciers are telling us.
They are melting—and through the glowing lens of infrared, the truth has never been clearer.